
How Apdex Can Find The Source Of Poor Performance
My colleagues and I recently published a comprehensive report showing consumer internet latency performance experienced in well-connected US cities in 2022. The report is an Apdex analysis of 460 million internet latency tests. The value of this report to the Apdex community is that it outlines a well established Apdex methodology. The key elements are as follows:
Focus on the study objective. Make sure that measurements cover primary and secondary elements of the system. This is important so that subsystems can be analyzed in isolation. Isolation is essential to identify poor performance causes.
Normalize Apdex scores by subsystem in order to not have known fixed subsystem differences influence the outcome. Normalization is best implemented by applying custom T and F thresholds.
Exclude bad data which is known to be caused by the measurement system. Therefore, it is critical to understand where and how the measurement system can supply wrong or outlier results.
Evaluate the resulting Apdex scores in detail. The analysis should not roll-up all the results into one or a few Apdex scores that are hardly different. Showing Apdex in fine detail highlights real underlying issues.
Investigate the raw values within the three Apdex performance zones: Satisfied, Tolerated, and Frustrated. This is critical to understanding the root cause of poor performance. Which of the zones shifted Apdex significantly? Since many Frustrated samples have a big impact on Apdex, and it is an open-ended zone, how bad was the frustrated range? Which sub-system was responsible for the Frustrated samples?
In this report, the required normalization pertained to physical distance between a testing probe in a home and a target server across the internet. Latency is fundamentally governed by the speed of light. Probe-to-target distances formed a latency floor that cannot be overcome. However, added latency times above that floor are in the control of the internet service providers (local, transit, distant).
We determined the base T (satisfied-tolerated threshold) and F (frustrated threshold) for each of 55 probe-target pairs under optimal conditions. We then applied these unique T and F values to the analysis. The objective was to remove distance from the analysis. Our study specifically had a focus of near (within the probe’s metropolitan area) and far (across the US internet) tests. So, normalizing near and far was important.
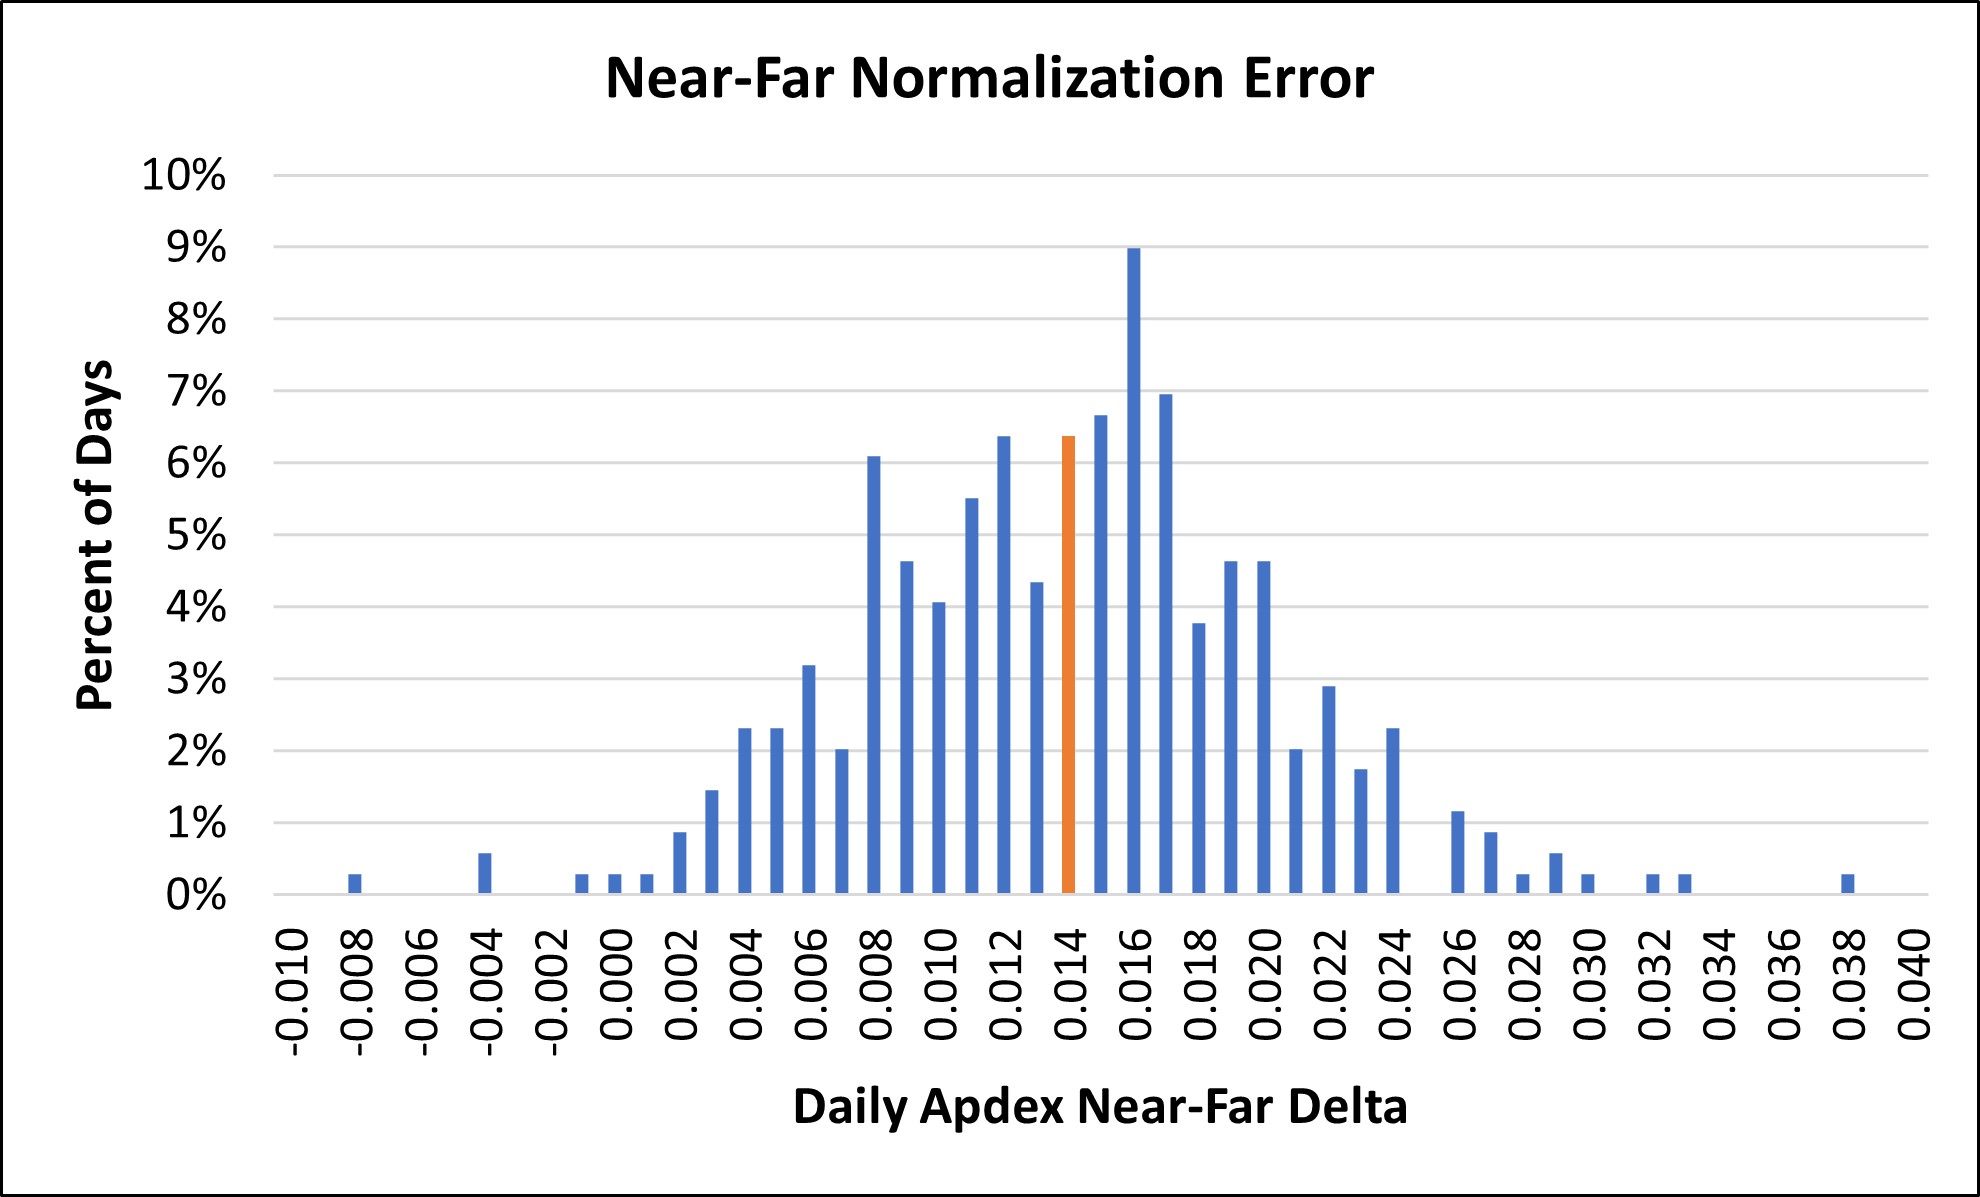 We checked how well the normalization worked. The chart below shows the daily Apdex near-minus-far error over the entire 2022 measurement period. Both the mean and median (red bar below) are Apdex 0.014 which is remarkably low given the size and complexity of the study. It indicates that there was still a slight bias towards near tests. The chart below is a histogram plot of the data shown in Figure 6 of our report.
The report has an extensive methodology section which members of this Apdex Users Group may find useful. It also features highly detailed results for each calendar quarter of results by city and ISP. It is a good example of the methodology Evaluate step described above. Finally, the NetForecast report Figure 9 shows the clear source of frustrated latency events which is a good example of the Investigate step.
See the NetForecast 2022 Internet Latency Benchmark Report here.